The Fastest and Slowest Metros for Internet in 2024
We analyzed all US metro areas to determine which ones have the fastest and slowest internet speeds
Feb 26, 2024 | Share
Industry Exclusive/Entertainment
The median internet speed among US metro areas is 105.8 Mbps—a 38.3% increase from 2022, when the median was 76.5 Mbps. But the difference between the fastest and slowest metros is a whopping 167.7 Mbps.
If you’re running into trouble with slow speeds for remote work, streaming, or online gaming, you could find the fastest internet provider in your area. But you might have better luck moving to a new metro with faster internet.
Using proprietary speed test data from HighSpeedInternet.com, we analyzed all metropolitan statistical areas in the US and Puerto Rico to determine which ones have the fastest and slowest internet speeds. You can read more about our methodology at the end of this report.
US metro areas with the fastest and slowest internet
Metro areas with the fastest internet speeds
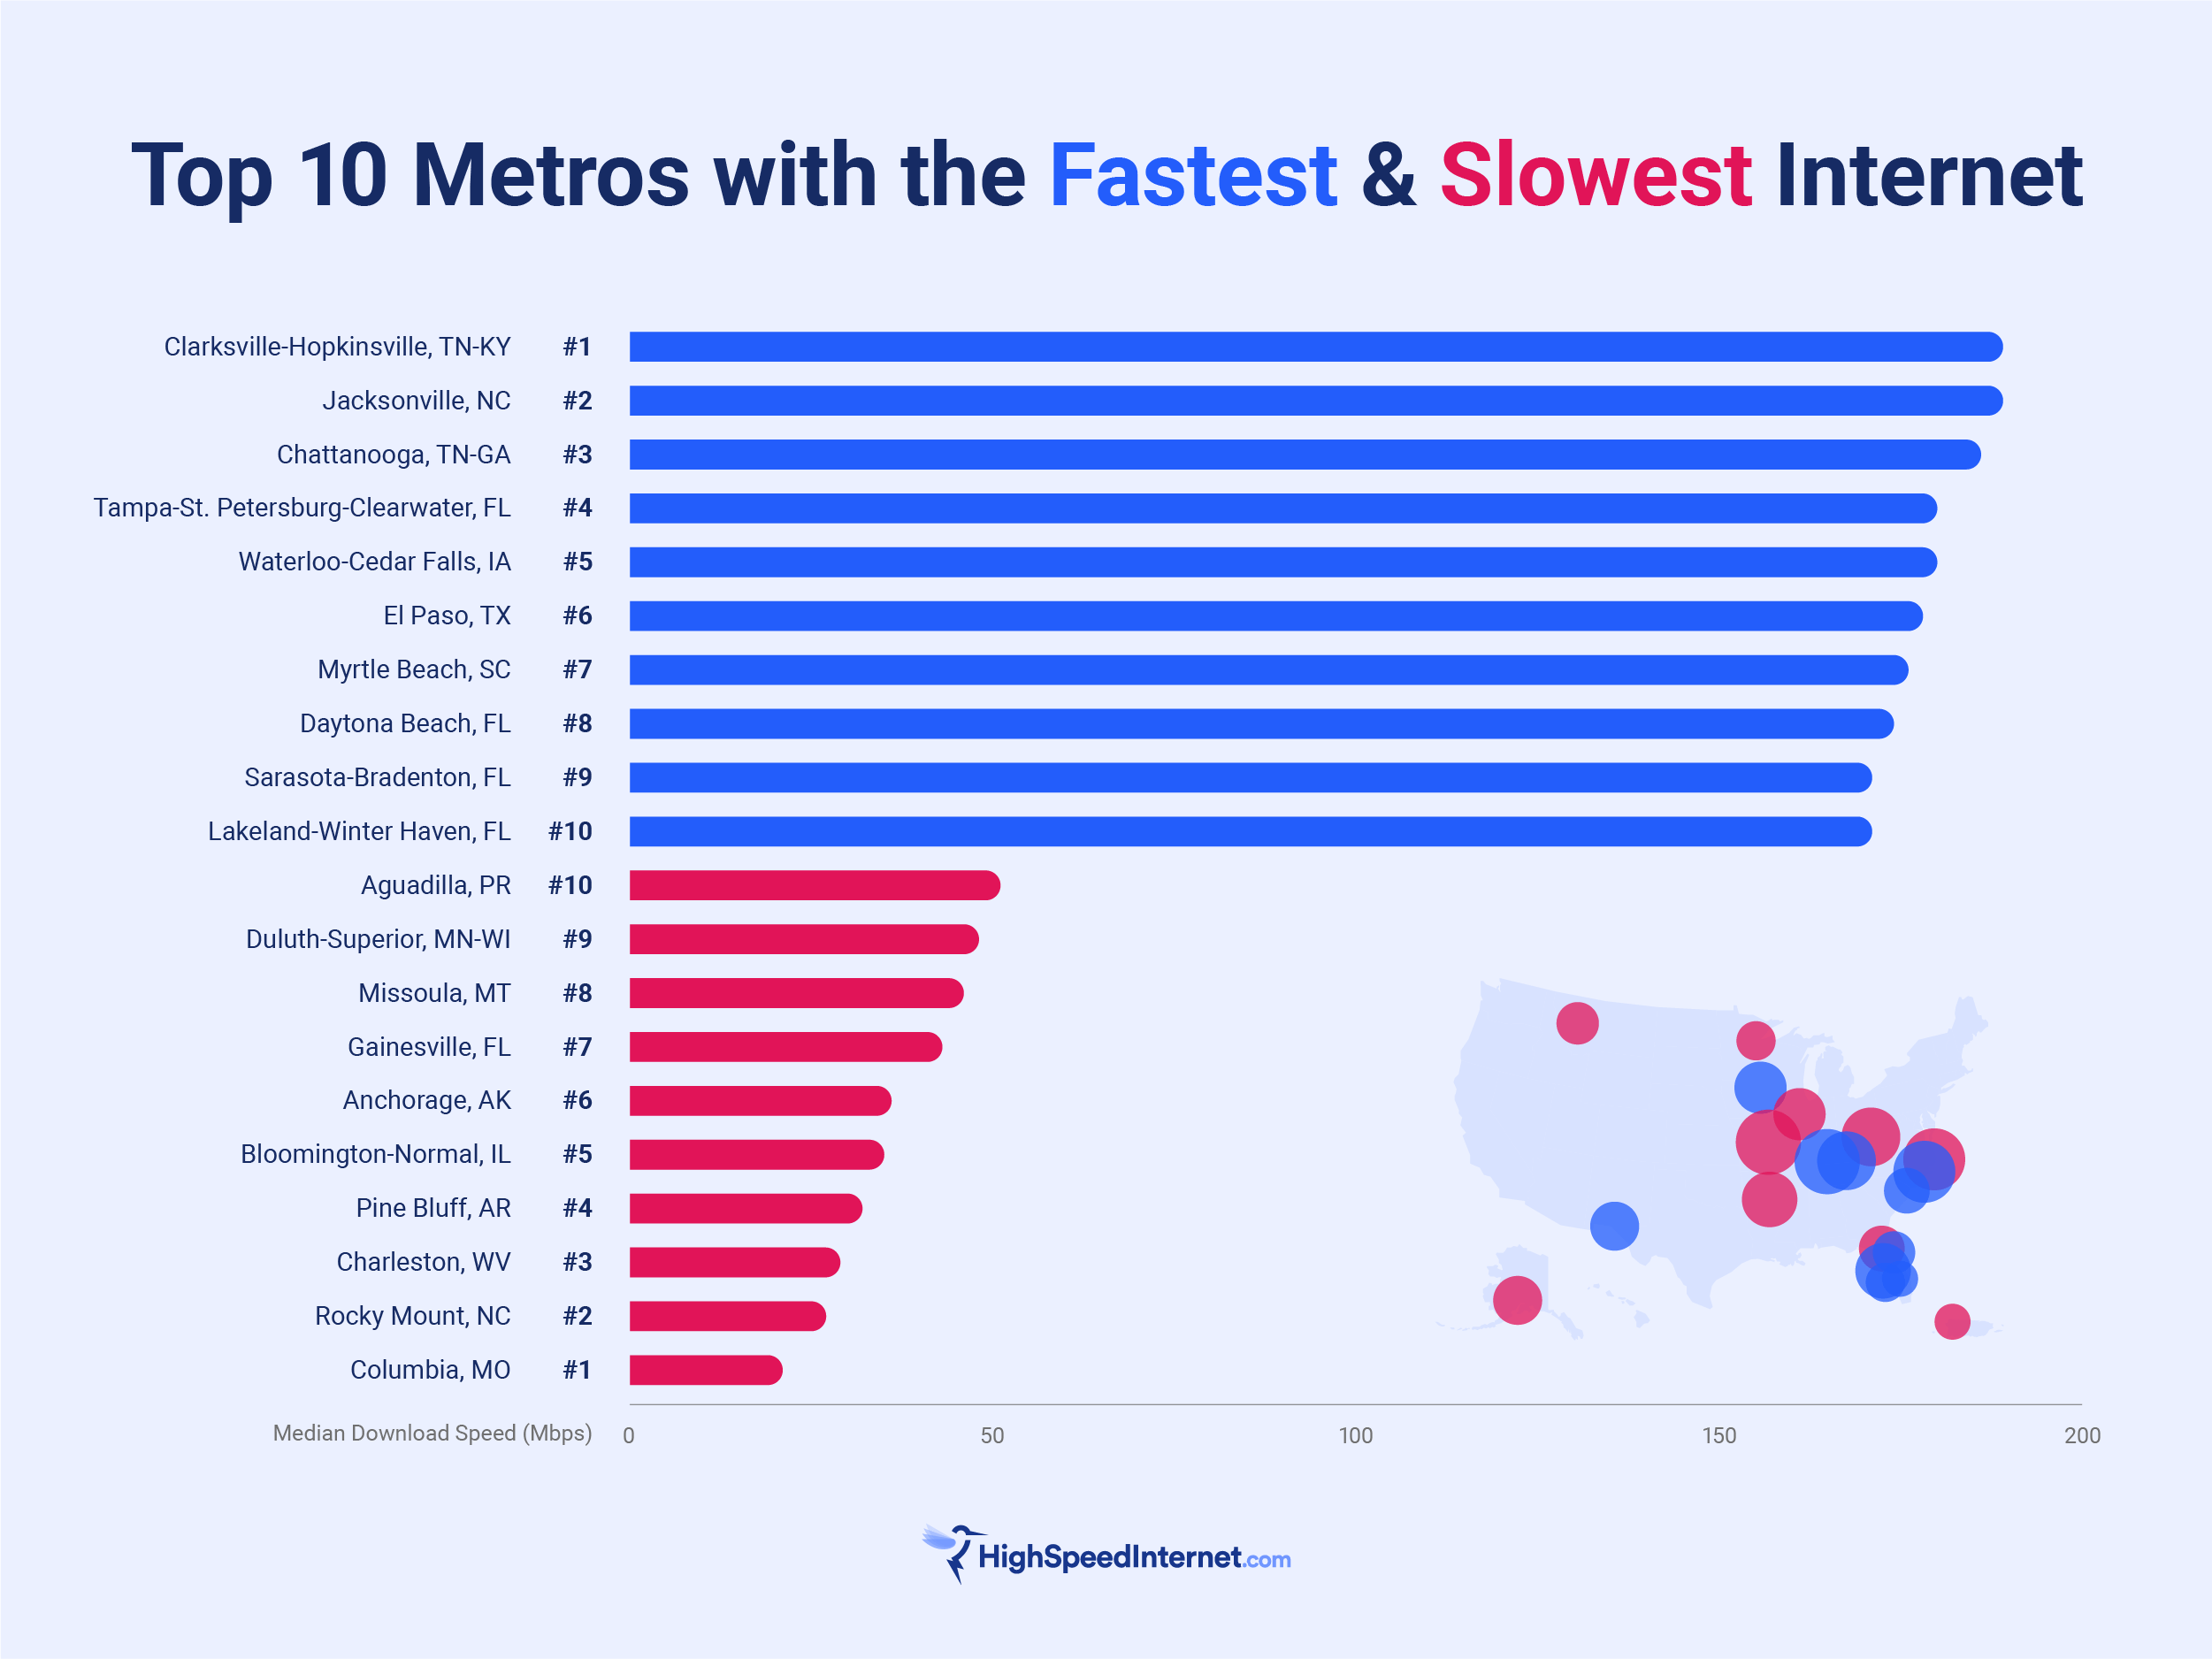
The Clarksville-Hopkinsville metro area, crossing the state border between Tennessee and Kentucky, tops the list with a median download speed of 189 Mbps—that’s 83.2 Mbps faster than the median internet speed among all metros.
Among all 278 metro areas we analyzed, a total of 160 had median download speeds of 100 Mbps or faster—which is considered a good speed for downloading large files, streaming high-definition video on multiple devices or online gaming.
Metro areas with the slowest internet speeds
Columbia, Missouri, had the slowest median speed by far, coming in at 21.3 Mbps. The next slowest was Rocky Mount, North Carolina, with 27.4 Mbps. Of all the metros we analyzed, 118 of them had median download speeds slower than 100 Mbps.
Metro areas with the most improved internet speeds
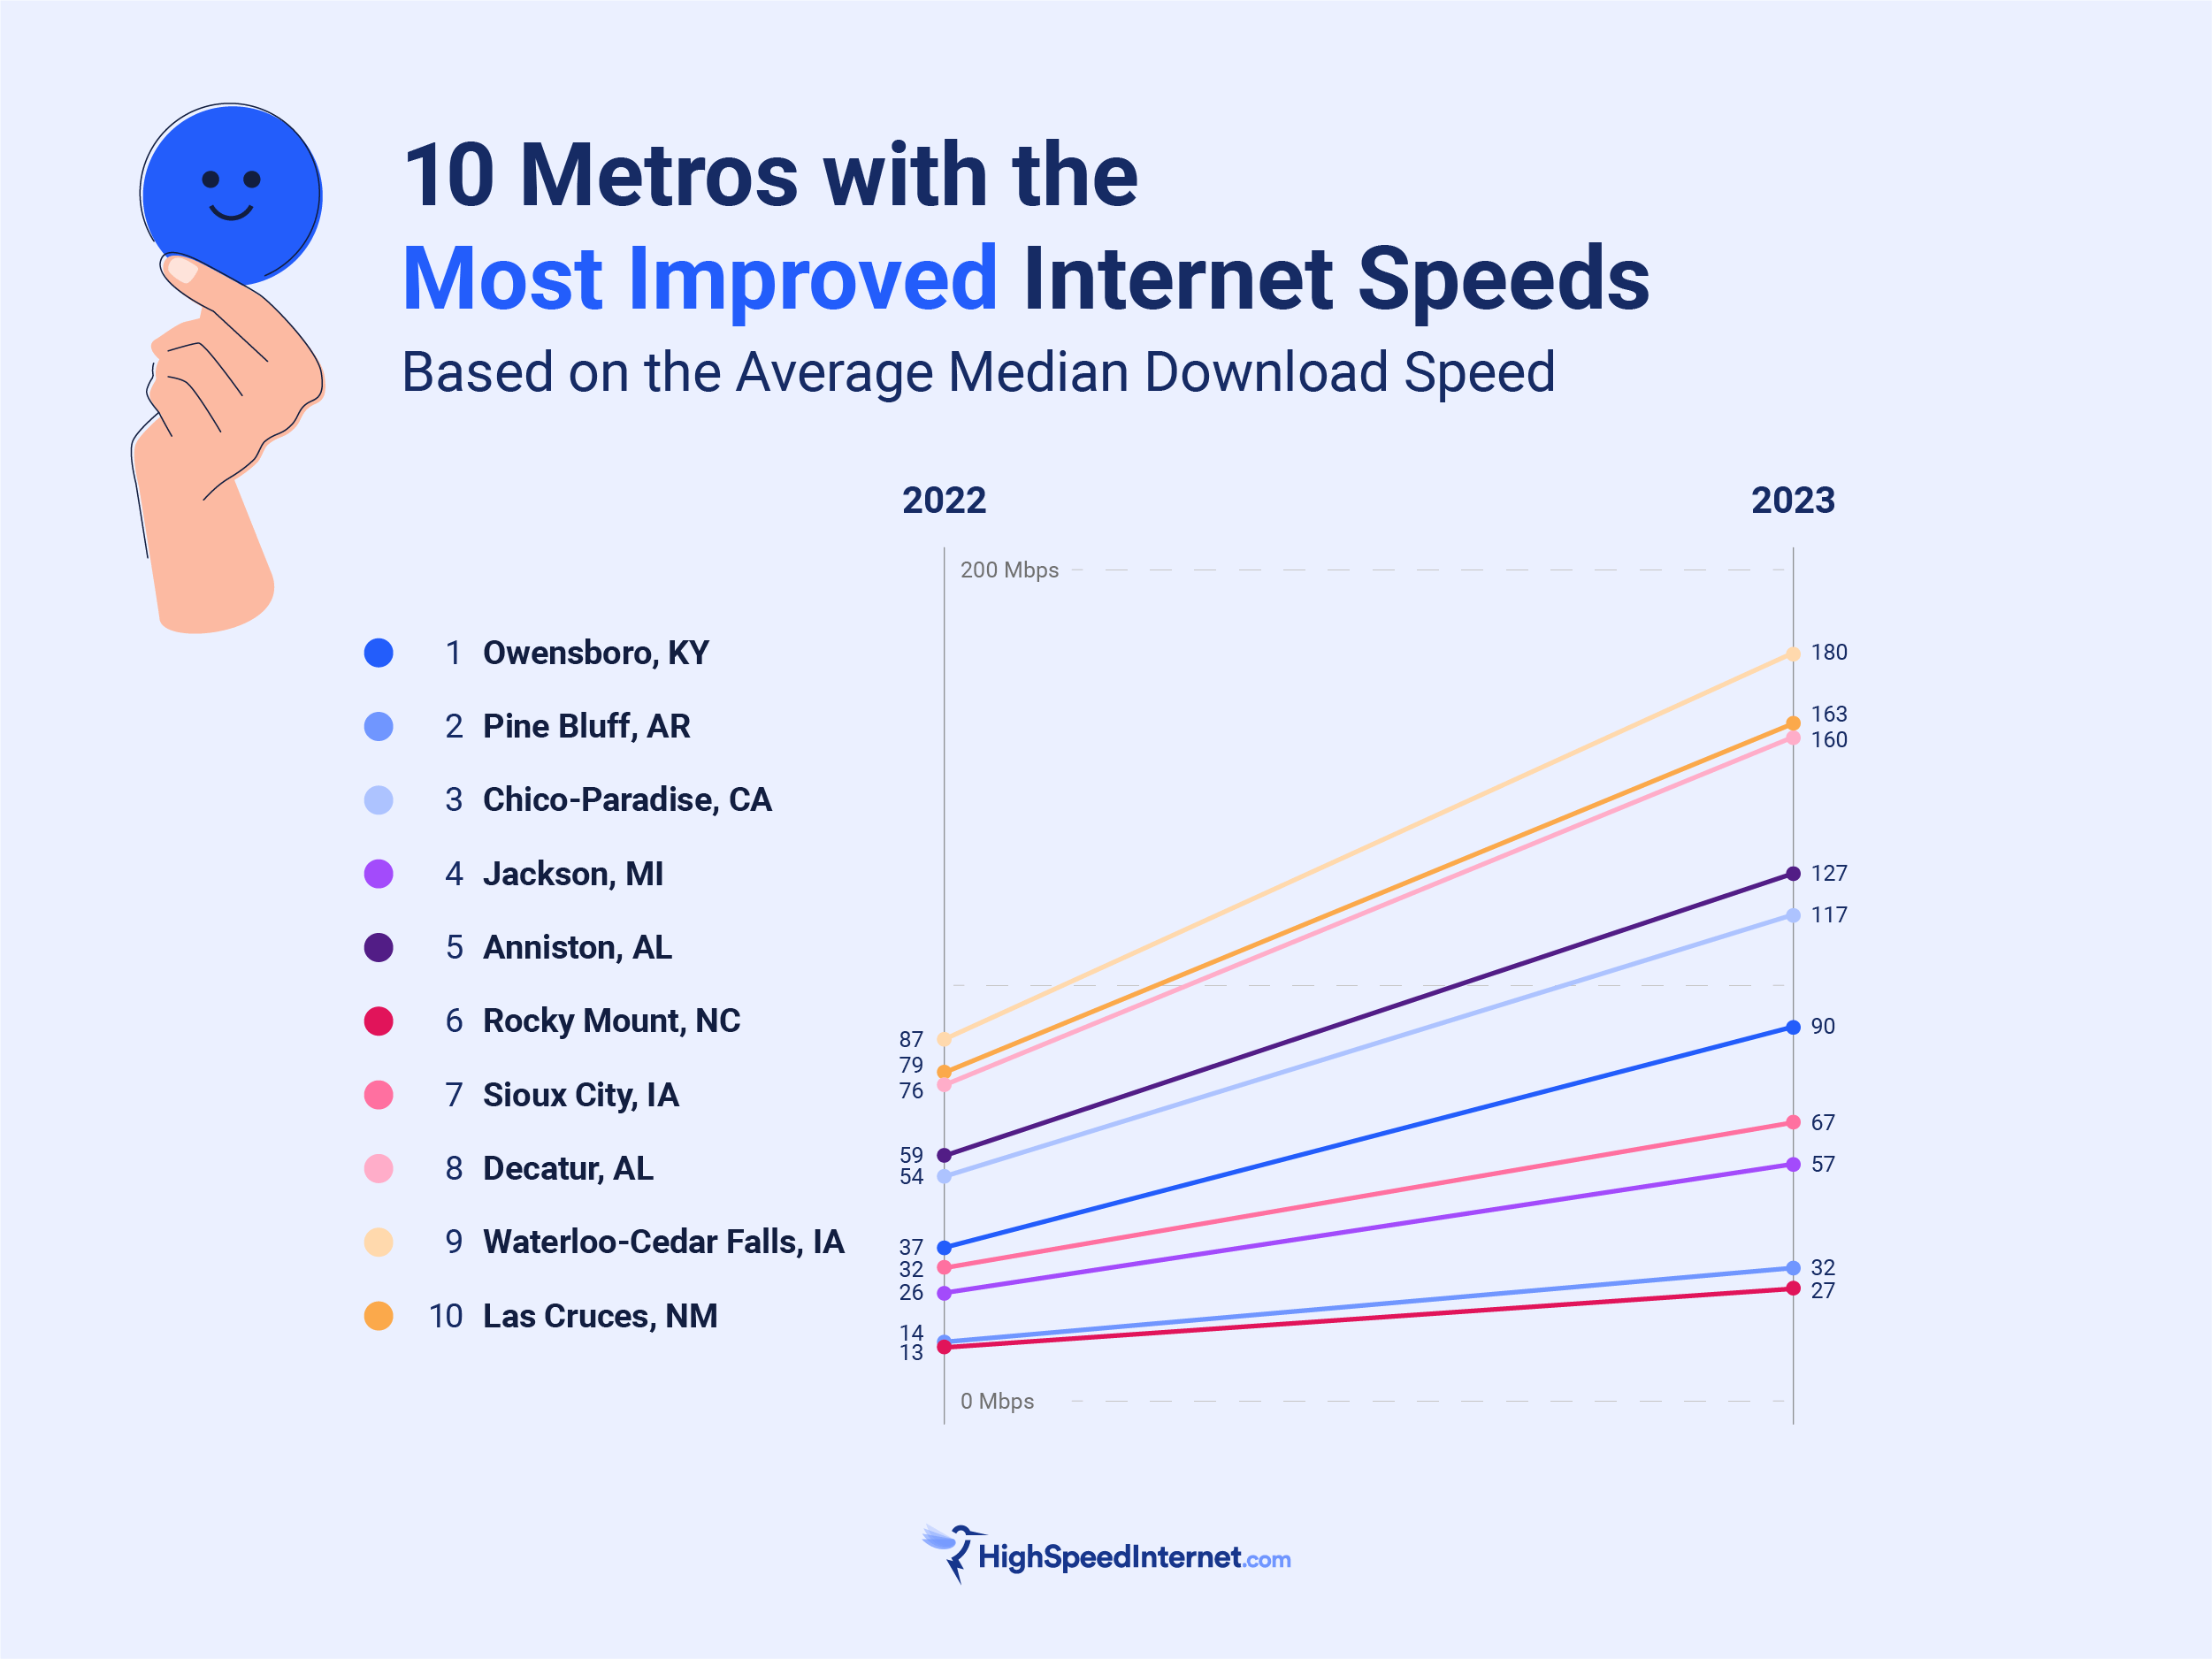
In addition to 2023 internet speeds, we also analyzed speeds from the same period in 2022 to find out which metro cities have improved the most or least.
Of all the US metros, a total of 128 improved their median internet speeds by more than 50% and 12 of them improved by more than 100%. Only four metro cities had a percentage growth of zero or less. In other words, 274 metros have improved in the past 12 months.
Metro areas with the least improved internet speeds
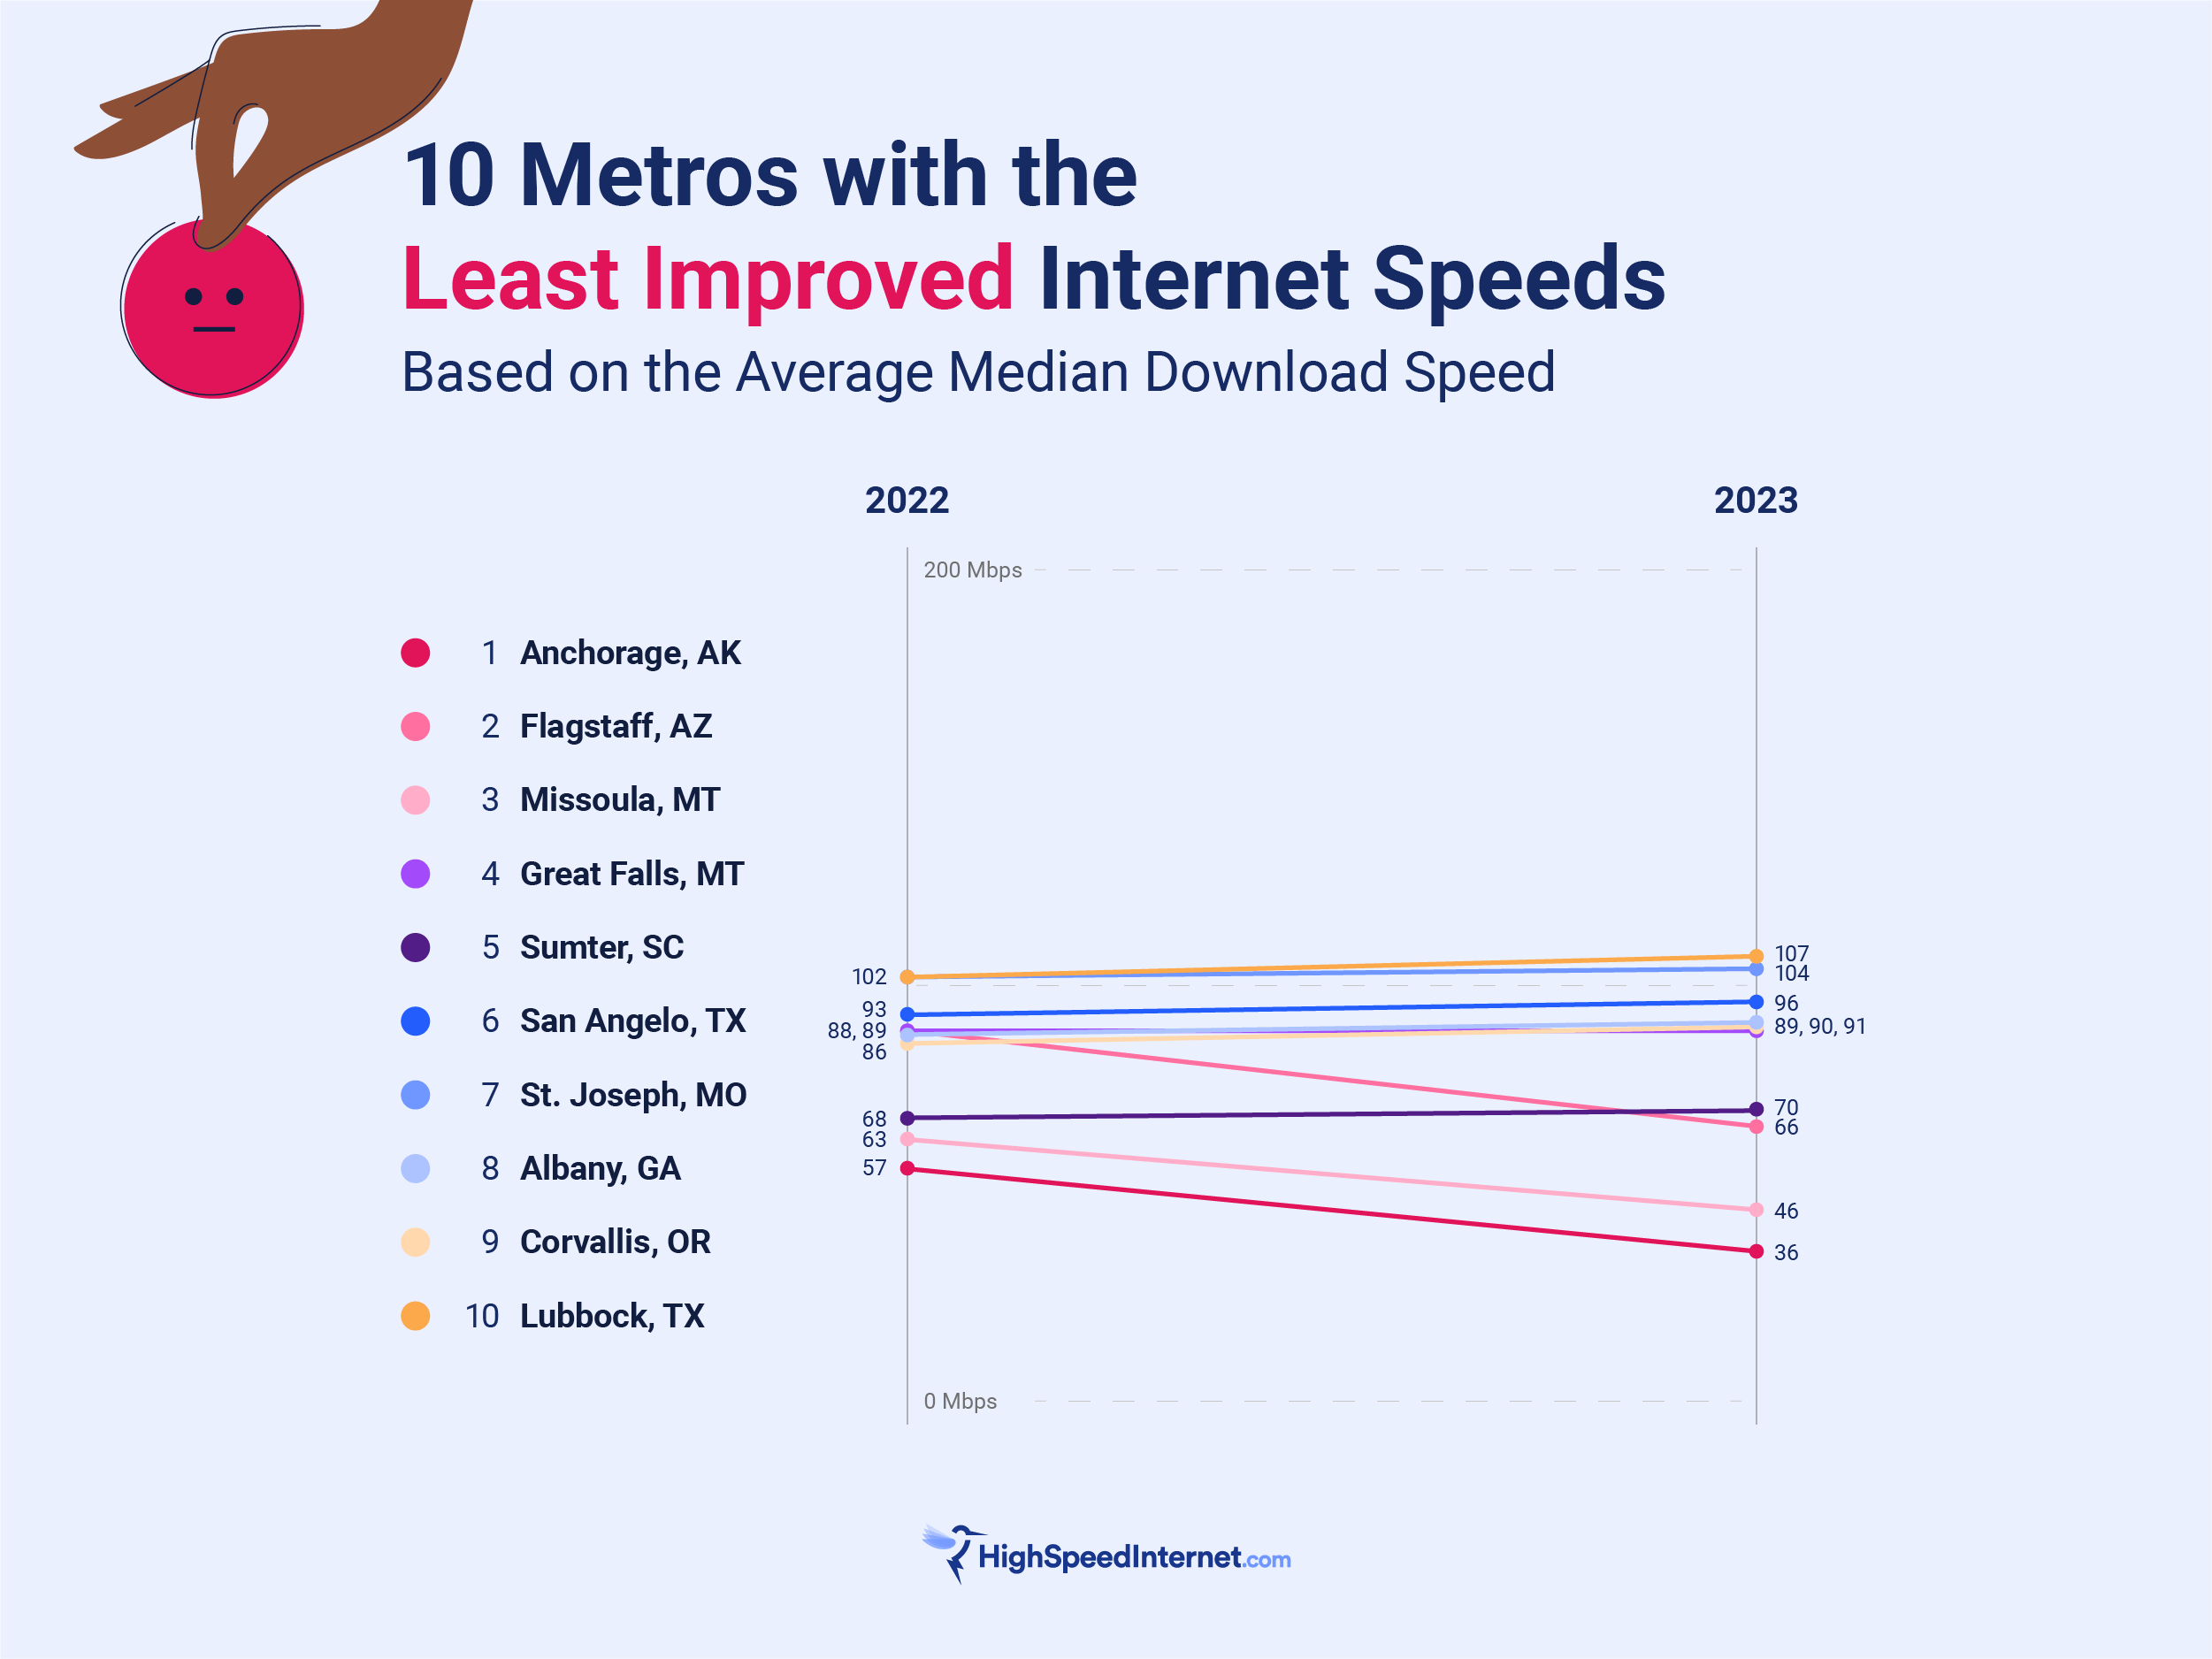
On the other end of the spectrum, only 25 metros improved by less than 20%. Just one remained unchanged, and only three metro areas saw a decline in speeds year-over-year.
The least improved metro—Anchorage, Alaska—aligns with our recent report on the US states with the fastest and slowest internet speeds. In that report (which uses the same methodology), we found Alaska to be the state with the slowest median internet speeds. We also found that most of the slowest states were more rural, such as Montana.
How much internet speed do you need?
If it seems like you can’t catch a break when it comes to internet or Wi-Fi in your area, fear not. We have several resources that can help make sure you’re getting the fastest speeds possible in the price range that is right for you. If you share Wi-Fi with multiple people, or among multiple internet-connected devices, you’ll want to first figure out what speed is best for you.
Next, use our zip code look-up below to find out which providers are available in your area. We break it down by speed, price, perks, ratings, and more—so you can find the connection that best suits your lifestyle.
Shopping around for new internet?
Enter your zip code below to see which providers are available in your area.
How do you get faster internet speeds?
The internet speeds you can get depend most heavily on what’s available in your area. Internet providers have to make big investments to build fast fiber-optic networks and 5G networks, and some communities end up underserved.
But there’s still a lot you can do to boost your home internet speeds. Here are some recommendations.
- Close out unnecessary browser windows and apps when you’re not using them.
- Move your router to a centralized location in your house, so your Wi-Fi signal connects better to all of your devices.
- Switch to the 5GHz frequency band on your router for a smoother connection.
- Upgrade your router to a model with Wi-Fi 6 standards, which can route bandwidth better and handle more users.
- Choose a faster internet plan—or switch to a faster internet provider.
- Remove bandwidth-hogging Wi-Fi devices from your network.
Complete rankings: Every metro area’s median internet speed, from fastest to slowest
See below the full list of all 278 US metropolitan areas we analyzed, along with their rankings and pertinent statistics. The following list is organized by median 2023 speed—if you’re looking for a specific city or state, use the Command+F (or Ctrl+F) function to search for it.
| Rank (fastest to slowest internet speeds) | Metropolitan area | 2023 median download speed (Mbps) | 2022 median download speed (Mbps) | Year-over-year growth | Rank (most to least improved) |
|---|---|---|---|---|---|
| 1 | Clarksville-Hopkinsville, TN-KY | 189.0 | 101.4 | 86.4% | 21 |
| 2 | Jacksonville, NC | 188.9 | 111.1 | 70.1% | 49 |
| 3 | Chattanooga, TN-GA | 186.4 | 115.4 | 61.5% | 73 |
| 4 | Tampa-St. Petersburg-Clearwater, FL | 180.5 | 120.4 | 49.9% | 130 |
| 5 | Waterloo-Cedar Falls, IA | 179.8 | 87.2 | 106.3% | 9 |
| 6 | El Paso, TX | 178.3 | 126.2 | 41.4% | 173 |
| 7 | Myrtle Beach, SC | 175.9 | 98.9 | 77.8% | 38 |
| 8 | Daytona Beach, FL | 173.8 | 97.3 | 78.6% | 35 |
| 9 | Sarasota-Bradenton, FL | 171.0 | 110.9 | 54.2% | 105 |
| 10 | Lakeland-Winter Haven, FL | 171.0 | 135.5 | 26.2% | 238 |
| 11 | Orlando, FL | 171.0 | 111.7 | 53.0% | 111 |
| 12 | Melbourne-Titusville-Palm Bay, FL | 167.1 | 95.8 | 74.3% | 43 |
| 13 | Killeen-Temple, TX | 164.9 | 92.9 | 77.5% | 39 |
| 14 | Huntsville, AL | 164.0 | 103.9 | 58.0% | 88 |
| 15 | Las Cruces, NM | 162.7 | 79.3 | 105.2% | 10 |
| 16 | Decatur, AL | 160.4 | 75.9 | 111.4% | 8 |
| 17 | Dover, DE | 159.4 | 97.3 | 63.9% | 62 |
| 18 | Fort Pierce-Port St. Lucie, FL | 157.1 | 91.8 | 71.1% | 48 |
| 19 | Bryan-College Station, TX | 156.7 | 89.7 | 74.7% | 41 |
| 20 | Jacksonville, FL | 155.2 | 95.5 | 62.6% | 66 |
| 21 | Yuma, AZ | 154.6 | 109.1 | 41.7% | 169 |
| 22 | Providence-Fall River-Warwick, RI-MA | 153.9 | 94.0 | 63.7% | 64 |
| 23 | West Palm Beach-Boca Raton, FL | 153.1 | 98.2 | 55.9% | 97 |
| 24 | Knoxville, TN | 151.0 | 92.2 | 63.8% | 63 |
| 25 | Panama City, FL | 149.4 | 100.4 | 48.7% | 142 |
| 26 | Hartford, CT | 149.0 | 83.5 | 78.4% | 37 |
| 27 | Wilmington, NC | 148.2 | 91.1 | 62.5% | 67 |
| 28 | San Antonio, TX | 147.3 | 109.7 | 34.2% | 206 |
| 29 | Nashville, TN | 146.9 | 99.5 | 47.6% | 148 |
| 30 | Miami-Fort Lauderdale, FL | 146.4 | 98.2 | 49.0% | 137 |
| 31 | Punta Gorda, FL | 146.2 | 108.8 | 34.4% | 205 |
| 32 | Barnstable-Yarmouth, MA | 144.8 | 92.7 | 56.2% | 96 |
| 33 | Fort Collins-Loveland, CO | 144.4 | 97.7 | 47.8% | 146 |
| 34 | Norfolk-Virginia Beach-Newport News, VA-NC | 144.4 | 88.5 | 63.2% | 65 |
| 35 | Naples, FL | 144.0 | 85.7 | 68.0% | 57 |
| 36 | Santa Barbara-Santa Maria-Lompoc, CA | 143.5 | 90.7 | 58.2% | 87 |
| 37 | Pittsfield, MA | 143.5 | 74.0 | 93.8% | 19 |
| 38 | Victoria, TX | 142.9 | 70.3 | 103.4% | 12 |
| 39 | Jackson, TN | 142.9 | 85.5 | 67.0% | 58 |
| 40 | Houston-Galveston-Brazoria, TX | 142.7 | 101.0 | 41.2% | 174 |
| 41 | Fort Walton Beach, FL | 142.3 | 88.3 | 61.3% | 74 |
| 42 | Philadelphia-Wilmington-Atlantic City, PA-NJ-DE-MD | 141.5 | 101.6 | 39.2% | 181 |
| 43 | Elmira, NY | 140.6 | 82.7 | 70.0% | 50 |
| 44 | Washington-Baltimore, DC-MD-VA-WV | 140.6 | 107.3 | 31.1% | 218 |
| 45 | Boston-Worcester-Lawrence, MA-NH-ME-CT | 140.3 | 93.7 | 49.7% | 132 |
| 46 | Abilene, TX | 139.5 | 114.7 | 21.6% | 248 |
| 47 | Charleston-North Charleston, SC | 138.6 | 89.3 | 55.1% | 100 |
| 48 | Greensboro-Winston-Salem-High Point, NC | 138.0 | 89.7 | 53.9% | 107 |
| 49 | Augusta-Aiken, GA-SC | 136.6 | 91.9 | 48.7% | 143 |
| 50 | Charlotte-Gastonia-Rock Hill, NC-SC | 136.2 | 96.7 | 40.9% | 176 |
| 51 | Savannah, GA | 135.6 | 81.9 | 65.6% | 61 |
| 52 | Fayetteville, NC | 135.3 | 96.3 | 40.6% | 177 |
| 53 | Gadsden, AL | 135.2 | 88.0 | 53.6% | 108 |
| 54 | Corpus Christi, TX | 134.6 | 78.1 | 72.3% | 45 |
| 55 | Grand Junction, CO | 134.5 | 84.3 | 59.6% | 81 |
| 56 | Shreveport-Bossier City, LA | 134.1 | 83.6 | 60.5% | 78 |
| 57 | Pittsburgh, PA | 133.5 | 92.0 | 45.2% | 156 |
| 58 | San Francisco-Oakland-San Jose, CA | 133.4 | 92.3 | 44.5% | 160 |
| 59 | Pensacola, FL | 132.3 | 81.7 | 62.1% | 72 |
| 60 | Tuscaloosa, AL | 132.2 | 82.8 | 59.7% | 80 |
| 61 | Williamsport, PA | 131.7 | 88.2 | 49.4% | 133 |
| 62 | Goldsboro, NC | 131.5 | 86.3 | 52.4% | 116 |
| 63 | Cincinnati-Hamilton, OH-KY-IN | 131.0 | 89.7 | 46.0% | 152 |
| 64 | Montgomery, AL | 130.5 | 82.1 | 59.1% | 83 |
| 65 | Raleigh-Durham-Chapel Hill, NC | 129.4 | 92.8 | 39.5% | 179 |
| 66 | Bellingham, WA | 129.0 | 85.9 | 50.2% | 127 |
| 67 | Austin-San Marcos, TX | 128.9 | 115.0 | 12.0% | 260 |
| 68 | York, PA | 128.6 | 93.8 | 37.1% | 189 |
| 69 | Florence, AL | 128.1 | 86.0 | 48.9% | 140 |
| 70 | Anniston, AL | 127.3 | 58.8 | 116.4% | 5 |
| 71 | Beaumont-Port Arthur, TX | 126.9 | 85.5 | 48.4% | 145 |
| 72 | Amarillo, TX | 126.7 | 70.7 | 79.1% | 34 |
| 73 | Reno, NV | 126.3 | 96.0 | 31.5% | 217 |
| 74 | Lafayette, IN | 125.6 | 90.9 | 38.2% | 185 |
| 75 | Fayetteville-Springdale-Rogers, AR | 125.2 | 92.3 | 35.7% | 200 |
| 76 | Provo-Orem, UT | 125.2 | 79.4 | 57.6% | 91 |
| 77 | Indianapolis, IN | 124.6 | 91.3 | 36.6% | 193 |
| 78 | Greenville-Spartanburg-Anderson, SC | 124.3 | 92.1 | 35.0% | 204 |
| 79 | Richmond-Petersburg, VA | 124.1 | 99.3 | 25.0% | 242 |
| 80 | Los Angeles-Riverside-Orange County, CA | 123.3 | 101.4 | 21.6% | 247 |
| 81 | State College, PA | 122.7 | 67.5 | 81.7% | 31 |
| 82 | Waco, TX | 122.7 | 81.2 | 51.1% | 122 |
| 83 | Janesville-Beloit, WI | 121.8 | 73.2 | 66.5% | 60 |
| 84 | Laredo, TX | 121.5 | 89.0 | 36.6% | 191 |
| 85 | Champaign-Urbana, IL | 121.4 | 84.4 | 43.8% | 162 |
| 86 | Auburn-Opelika, AL | 121.3 | 92.6 | 31.1% | 219 |
| 87 | Kansas City, MO-KS | 120.6 | 83.5 | 44.4% | 161 |
| 88 | Yuba City, CA | 120.6 | 79.4 | 52.0% | 118 |
| 89 | Jonesboro, AR | 120.5 | 84.0 | 43.4% | 163 |
| 90 | Stockton-Lodi, CA | 120.2 | 80.5 | 49.4% | 134 |
| 91 | New York-Northern New Jersey-Long Island, NY-NJ-CT-PA | 119.9 | 94.4 | 27.0% | 232 |
| 92 | Odessa-Midland, TX | 119.7 | 73.8 | 62.2% | 70 |
| 93 | Youngstown-Warren, OH | 119.0 | 70.0 | 70.0% | 52 |
| 94 | Florence, SC | 118.3 | 84.5 | 39.9% | 178 |
| 95 | Enid, OK | 118.1 | 86.7 | 36.3% | 196 |
| 96 | Atlanta, GA | 117.8 | 92.1 | 27.9% | 225 |
| 97 | Louisville, KY-IN | 117.8 | 83.2 | 41.6% | 171 |
| 98 | Columbia, SC | 117.5 | 85.5 | 37.3% | 187 |
| 99 | Oklahoma City, OK | 117.5 | 77.4 | 51.7% | 120 |
| 100 | Chico-Paradise, CA | 117.0 | 53.6 | 118.2% | 3 |
| 101 | Kalamazoo-Battle Creek, MI | 117.0 | 83.9 | 39.4% | 180 |
| 102 | Honolulu, HI | 116.8 | 80.7 | 44.8% | 158 |
| 103 | Salt Lake City-Ogden, UT | 116.8 | 76.5 | 52.8% | 114 |
| 104 | Dayton-Springfield, OH | 116.8 | 76.4 | 52.8% | 113 |
| 105 | Grand Forks, ND-MN | 116.7 | 80.7 | 44.6% | 159 |
| 106 | Evansville-Henderson, IN-KY | 115.9 | 85.6 | 35.4% | 203 |
| 107 | Brownsville-Harlingen-San Benito, TX | 115.9 | 91.6 | 26.5% | 235 |
| 108 | McAllen-Edinburg-Mission, TX | 115.4 | 90.6 | 27.4% | 229 |
| 109 | Madison, WI | 115.1 | 90.0 | 27.9% | 224 |
| 110 | Fort Myers-Cape Coral, FL | 115.1 | 58.0 | 98.4% | 14 |
| 111 | Las Vegas, NV-AZ | 114.3 | 77.0 | 48.4% | 144 |
| 112 | Sharon, PA | 113.6 | 72.9 | 55.9% | 98 |
| 113 | Springfield, IL | 113.5 | 72.0 | 57.6% | 90 |
| 114 | South Bend, IN | 113.1 | 61.7 | 83.2% | 27 |
| 115 | Columbus, GA-AL | 112.7 | 77.4 | 45.6% | 153 |
| 116 | San Diego, CA | 112.5 | 84.9 | 32.5% | 213 |
| 117 | Athens, GA | 112.3 | 69.2 | 62.3% | 69 |
| 118 | Phoenix-Mesa, AZ | 112.2 | 64.0 | 75.4% | 40 |
| 119 | New London-Norwich, CT-RI | 112.1 | 78.4 | 42.9% | 164 |
| 120 | Roanoke, VA | 111.7 | 65.0 | 72.0% | 46 |
| 121 | Lexington, KY | 111.3 | 70.1 | 58.7% | 85 |
| 122 | Grand Rapids-Muskegon-Holland, MI | 111.0 | 73.9 | 50.2% | 126 |
| 123 | Colorado Springs, CO | 110.9 | 72.6 | 52.9% | 112 |
| 124 | Visalia-Tulare-Porterville, CA | 110.9 | 73.8 | 50.3% | 124 |
| 125 | Baton Rouge, LA | 110.6 | 82.7 | 33.7% | 208 |
| 126 | Portland, ME | 110.5 | 65.5 | 68.7% | 56 |
| 127 | Lancaster, PA | 110.4 | 74.7 | 47.7% | 147 |
| 128 | Eau Claire, WI | 109.9 | 77.4 | 42.0% | 168 |
| 129 | Milwaukee-Racine, WI, | 109.4 | 84.3 | 29.7% | 221 |
| 130 | Rockford, IL | 108.5 | 84.9 | 27.7% | 227 |
| 131 | Denver-Boulder-Greeley, CO | 108.4 | 74.6 | 45.3% | 154 |
| 132 | Detroit-Ann Arbor-Flint, MI | 108.3 | 79.4 | 36.5% | 195 |
| 133 | Richland-Kennewick-Pasco, WA | 108.2 | 80.9 | 33.7% | 207 |
| 134 | Wichita Falls, TX | 108.2 | 78.0 | 38.8% | 183 |
| 135 | San Luis Obispo-Atascadero-Paso Robles, CA | 107.2 | 89.6 | 19.7% | 251 |
| 136 | Merced, CA | 107.2 | 58.9 | 82.1% | 29 |
| 137 | Lubbock, TX | 106.9 | 102.0 | 4.8% | 269 |
| 138 | Rochester, MN | 106.5 | 78.5 | 35.8% | 199 |
| 139 | St. Louis, MO-IL | 105.8 | 84.7 | 24.9% | 243 |
| 140 | Reading, PA | 105.8 | 68.0 | 55.5% | 99 |
| 141 | Tucson, AZ | 105.7 | 58.1 | 81.9% | 30 |
| 142 | Asheville, NC | 105.6 | 92.1 | 14.7% | 257 |
| 143 | Erie, PA | 105.5 | 62.1 | 69.7% | 55 |
| 144 | Elkhart-Goshen, IN | 104.5 | 76.5 | 36.6% | 192 |
| 145 | St. Joseph, MO | 104.3 | 101.7 | 2.6% | 272 |
| 146 | Omaha, NE-IA | 104.2 | 59.8 | 74.2% | 44 |
| 147 | Green Bay, WI | 104.0 | 67.9 | 53.2% | 110 |
| 148 | Buffalo-Niagara Falls, NY | 103.6 | 80.8 | 28.2% | 223 |
| 149 | Tulsa, OK | 103.4 | 53.8 | 92.1% | 20 |
| 150 | Rapid City, SD | 103.3 | 71.3 | 45.0% | 157 |
| 151 | Columbus, OH | 103.2 | 81.2 | 27.1% | 231 |
| 152 | Benton Harbor, MI | 102.2 | 73.5 | 39.1% | 182 |
| 153 | Parkersburg-Marietta, WV-OH | 101.7 | 80.1 | 26.9% | 233 |
| 154 | Burlington, VT | 101.4 | 67.6 | 50.0% | 129 |
| 155 | Cumberland, MD-WV | 101.3 | 71.9 | 40.9% | 175 |
| 156 | Bakersfield, CA | 101.2 | 91.4 | 10.8% | 261 |
| 157 | Decatur, IL | 100.9 | 80.0 | 26.2% | 236 |
| 158 | Pueblo, CO | 100.8 | 88.3 | 14.2% | 258 |
| 159 | Sioux Falls, SD | 100.4 | 63.9 | 57.1% | 93 |
| 160 | Dallas-Fort Worth, TX | 100.0 | 93.0 | 7.5% | 265 |
| 161 | Albany-Schenectady-Troy, NY | 99.8 | 82.6 | 20.9% | 249 |
| 162 | Iowa City, IA | 99.7 | 64.5 | 54.7% | 101 |
| 163 | Wheeling, WV-OH | 99.4 | 69.6 | 42.8% | 165 |
| 164 | Harrisburg-Lebanon-Carlisle, PA | 98.4 | 76.0 | 29.5% | 222 |
| 165 | Wichita, KS | 98.3 | 69.4 | 41.6% | 170 |
| 166 | Glens Falls, NY | 98.3 | 67.7 | 45.3% | 155 |
| 167 | Medford-Ashland, OR | 97.8 | 64.1 | 52.4% | 115 |
| 168 | Ocala, FL | 97.7 | 60.2 | 62.4% | 68 |
| 169 | Portland-Salem, OR-WA | 97.5 | 71.6 | 36.1% | 197 |
| 170 | New Orleans, LA | 97.5 | 65.5 | 48.8% | 141 |
| 171 | Lima, OH | 96.8 | 80.9 | 19.7% | 250 |
| 172 | Jackson, MS | 96.7 | 64.8 | 49.3% | 135 |
| 173 | Fort Smith, AR-OK | 96.2 | 65.7 | 46.5% | 151 |
| 174 | Allentown-Bethlehem-Easton, PA | 96.2 | 70.5 | 36.5% | 194 |
| 175 | Appleton-Oshkosh-Neenah, WI | 96.0 | 69.3 | 38.5% | 184 |
| 176 | Chicago-Gary-Kenosha, IL-IN-WI | 95.9 | 78.7 | 21.9% | 246 |
| 177 | Seattle-Tacoma-Bremerton, WA | 95.8 | 74.9 | 27.9% | 226 |
| 178 | Houma, LA | 95.6 | 77.2 | 23.8% | 244 |
| 179 | San Angelo, TX | 95.5 | 93.3 | 2.3% | 273 |
| 180 | Sheboygan, WI | 95.4 | 74.8 | 27.5% | 228 |
| 181 | Steubenville-Weirton, OH-WV | 95.1 | 75.4 | 26.1% | 240 |
| 182 | Monroe, LA | 95.0 | 88.9 | 6.9% | 267 |
| 183 | Bloomington, IN | 94.8 | 84.3 | 12.4% | 259 |
| 184 | Johnstown, PA | 94.7 | 61.3 | 54.5% | 102 |
| 185 | Syracuse, NY | 94.6 | 85.4 | 10.8% | 262 |
| 186 | Bismarck, ND | 94.4 | 58.8 | 60.6% | 76 |
| 187 | Sherman-Denison, TX | 94.4 | 47.2 | 99.9% | 13 |
| 188 | Binghamton, NY | 93.9 | 65.9 | 42.5% | 166 |
| 189 | Salinas, CA | 93.7 | 67.8 | 38.2% | 186 |
| 190 | Lynchburg, VA | 93.6 | 50.5 | 85.6% | 23 |
| 191 | Sacramento-Yolo, CA | 93.6 | 70.4 | 33.0% | 210 |
| 192 | Cleveland-Akron, OH | 93.4 | 69.0 | 35.4% | 202 |
| 193 | Hickory-Morganton-Lenoir, NC | 93.4 | 74.0 | 26.1% | 239 |
| 194 | Minneapolis-St. Paul, MN-WI | 93.2 | 61.2 | 52.3% | 117 |
| 195 | Davenport-Moline-Rock Island, IA-IL | 92.9 | 65.3 | 42.3% | 167 |
| 196 | Toledo, OH | 92.7 | 51.0 | 81.7% | 32 |
| 197 | Memphis, TN-AR-MS | 92.6 | 58.2 | 59.0% | 84 |
| 198 | Lake Charles, LA | 92.6 | 61.7 | 50.1% | 128 |
| 199 | Peoria-Pekin, IL | 92.2 | 78.9 | 16.8% | 255 |
| 200 | Lafayette, LA | 92.0 | 84.2 | 9.3% | 264 |
| 201 | Muncie, IN | 91.9 | 70.2 | 30.9% | 220 |
| 202 | Cheyenne, WY | 91.6 | 68.9 | 32.9% | 211 |
| 203 | Wausau, WI | 91.4 | 46.3 | 97.5% | 16 |
| 204 | Albany, GA | 91.1 | 87.8 | 3.8% | 271 |
| 205 | Casper, WY | 90.4 | 76.3 | 18.5% | 253 |
| 206 | Biloxi-Gulfport-Pascagoula, MS | 90.4 | 49.3 | 83.2% | 26 |
| 207 | Corvallis, OR | 90.4 | 86.3 | 4.8% | 270 |
| 208 | Macon, GA | 90.3 | 50.0 | 80.5% | 33 |
| 209 | Yakima, WA | 90.3 | 78.7 | 14.7% | 256 |
| 210 | Owensboro, KY | 90.0 | 37.5 | 140.1% | 1 |
| 211 | Eugene-Springfield, OR | 90.0 | 57.0 | 58.0% | 89 |
| 212 | Mobile, AL | 89.9 | 58.6 | 53.5% | 109 |
| 213 | Johnson City-Kingsport-Bristol, TN-VA MS | 89.9 | 56.5 | 59.2% | 82 |
| 214 | Billings, MT | 89.7 | 75.4 | 19.1% | 252 |
| 215 | Huntington-Ashland, WV-KY-OH | 89.7 | 84.5 | 6.1% | 268 |
| 216 | Rochester, NY | 89.5 | 65.2 | 37.2% | 188 |
| 217 | Modesto, CA | 89.3 | 63.1 | 41.4% | 172 |
| 218 | Great Falls, MT | 89.2 | 89.2 | 0.0% | 275 |
| 219 | Spokane, WA | 88.9 | 57.8 | 53.9% | 106 |
| 220 | Santa Fe, NM | 88.7 | 70.9 | 25.2% | 241 |
| 221 | Tyler, TX | 88.1 | 79.9 | 10.3% | 263 |
| 222 | Alexandria, LA | 87.9 | 51.3 | 71.3% | 47 |
| 223 | Lawrence, KS | 87.1 | 54.3 | 60.5% | 77 |
| 224 | Lincoln, NE | 86.6 | 65.6 | 32.0% | 214 |
| 225 | Dothan, AL | 86.6 | 51.9 | 66.9% | 59 |
| 226 | Fresno, CA | 86.4 | 64.8 | 33.2% | 209 |
| 227 | Lansing-East Lansing, MI | 86.3 | 53.2 | 62.1% | 71 |
| 228 | Utica-Rome, NY | 86.1 | 65.4 | 31.6% | 216 |
| 229 | Kokomo, IN | 86.1 | 57.3 | 50.3% | 125 |
| 230 | St. Cloud, MN | 85.4 | 52.9 | 61.2% | 75 |
| 231 | Hattiesburg, MS | 84.2 | 56.5 | 49.0% | 139 |
| 232 | Scranton-Wilkes-Barre-Hazleton PA | 82.2 | 40.4 | 103.6% | 11 |
| 233 | Lawton, OK | 82.0 | 54.0 | 52.0% | 119 |
| 234 | Saginaw-Bay City-Midland, MI | 79.5 | 58.5 | 35.8% | 198 |
| 235 | Mansfield, OH | 79.0 | 39.8 | 98.2% | 15 |
| 236 | Lewiston-Auburn, ME | 77.9 | 51.7 | 50.6% | 123 |
| 237 | Des Moines, IA | 77.0 | 58.3 | 32.0% | 215 |
| 238 | Altoona, PA | 75.9 | 50.8 | 49.2% | 136 |
| 239 | Little Rock-North Little Rock, AR | 74.4 | 40.6 | 83.2% | 25 |
| 240 | Fort Wayne, IN | 73.4 | 41.1 | 78.6% | 36 |
| 241 | Topeka, KS | 73.2 | 39.4 | 85.8% | 22 |
| 242 | Fargo-Moorhead, ND-MN | 71.9 | 36.6 | 96.2% | 18 |
| 243 | Tallahassee, FL | 71.0 | 56.2 | 26.2% | 237 |
| 244 | Pocatello, ID | 70.9 | 45.9 | 54.5% | 103 |
| 245 | Springfield, MO | 70.0 | 44.4 | 57.5% | 92 |
| 246 | Sumter, SC | 69.6 | 68.1 | 2.2% | 274 |
| 247 | San Juan-Caguas-Arecibo, PR | 69.2 | 46.4 | 49.0% | 138 |
| 248 | Ponce, PR | 68.7 | 39.4 | 74.6% | 42 |
| 249 | Terre Haute, IN | 67.9 | 40.0 | 69.9% | 53 |
| 250 | Birmingham, AL | 67.7 | 53.5 | 26.5% | 234 |
| 251 | Redding, CA | 67.7 | 39.8 | 70.0% | 51 |
| 252 | Sioux City, IA-NE | 67.1 | 31.6 | 112.2% | 7 |
| 253 | Flagstaff, AZ-UT | 65.9 | 89.3 | -26.2% | 277 |
| 254 | Bangor, ME | 65.6 | 44.6 | 47.0% | 149 |
| 255 | Longview-Marshall, TX | 65.3 | 43.2 | 51.4% | 121 |
| 256 | La Crosse, WI-MN | 63.1 | 32.1 | 96.6% | 17 |
| 257 | Joplin, MO | 63.1 | 46.2 | 36.7% | 190 |
| 258 | Cedar Rapids, IA | 62.9 | 46.4 | 35.7% | 201 |
| 259 | Canton-Massillon, OH | 61.9 | 46.8 | 32.5% | 212 |
| 260 | Mayaguez, PR | 60.1 | 37.4 | 60.4% | 79 |
| 261 | Greenville, NC | 59.0 | 32.4 | 82.3% | 28 |
| 262 | Albuquerque, NM | 59.0 | 37.5 | 57.1% | 94 |
| 263 | Dubuque, IA | 57.3 | 48.9 | 17.0% | 254 |
| 264 | Jackson, MI | 57.1 | 26.3 | 117.5% | 4 |
| 265 | Texarkana, TX-Texarkana, AR | 57.1 | 36.0 | 58.6% | 86 |
| 266 | Springfield, MA | 56.6 | 38.5 | 46.9% | 150 |
| 267 | Boise City, ID | 55.3 | 35.3 | 56.5% | 95 |
| 268 | Charlottesville, VA | 52.9 | 34.3 | 54.3% | 104 |
| 269 | Aguadilla, PR | 51.1 | 41.5 | 23.1% | 245 |
| 270 | Duluth-Superior, MN-WI | 47.9 | 37.7 | 27.2% | 230 |
| 271 | Missoula, MT | 46.5 | 62.9 | -26.1% | 276 |
| 272 | Gainesville, FL | 42.6 | 23.2 | 83.5% | 24 |
| 273 | Anchorage, AK | 35.9 | 57.2 | -37.2% | 278 |
| 274 | Bloomington-Normal, IL | 35.0 | 23.3 | 49.9% | 131 |
| 275 | Pine Bluff, AR | 31.6 | 14.2 | 123.2% | 2 |
| 276 | Charleston, WV | 28.8 | 17.0 | 69.7% | 54 |
| 277 | Rocky Mount, NC | 27.4 | 12.8 | 114.3% | 6 |
| 278 | Columbia, MO | 21.3 | 19.8 | 7.4% | 266 |
Methodology
We analyzed over a million results of speed tests taken on HighSpeedInternet.com’s speed test tool and app in all US metropolitan statistical areas (per Zipcodes.com) from January 1 through September 30, 2023. Metros include multiple cities, and some even cross state lines—this gives a broader view of big cities and their internet speed.
If multiple speed tests were taken from the same IP address, we used only the highest results. We also filtered out results from tests taken on mobile devices and excluded any metropolitan areas that had less than 100 speed test results. To avoid outliers that may skew the data, we used the median download speeds (instead of the average) to determine rankings.
To determine year-over-year growth, we compared these results to those from the same period in 2022.
Author - Andrea Harvey
Andrea Harvey is a Utah-based writer and digital PR/outreach specialist. She has a B.A. in journalism from the University of Oregon and a background in local newspapers.
Editor - Andrea Harvey
Andrea Harvey is a Utah-based writer and digital PR/outreach specialist. She has a B.A. in journalism from the University of Oregon and a background in local newspapers.
